Spark Memory Overview and Troubleshooting
Spark Architecture
Apache Spark follows a driver/worker architecture. When a Spark application starts, the following flow executes:
- The driver loads the user program, instantiates a SparkContext
- The driver ask for resources from cluster manager to launch executors
- The cluster manager launches executors as requested
- The driver converts the user program into tasks
- The task are sent to executors
- Executors run the tasks and either:
- Task succeeds and saves the results
- The worker crashes and its tasks are sent to other executors
- Once SparkContext.stop() is called or if the driver exits/crashes, all the executors will be terminated and cluster manager releases the cluster resources
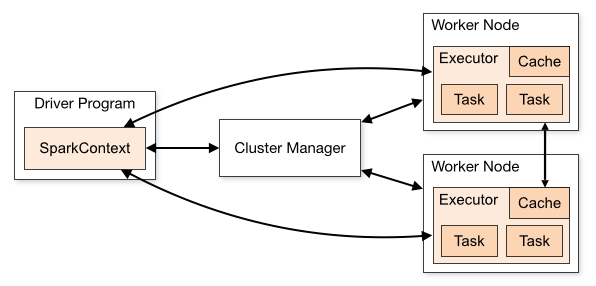
source: https://spark.apache.org/docs/latest/cluster-overview.html
One of the most common causes of worker crashes is OOM. What causes OOMs to occur? First we need to understand Spark executor memory structure. Note, in some cases it is possible for the driver to OOM as well, the following methods can also be applied.
Spark Executor Memory
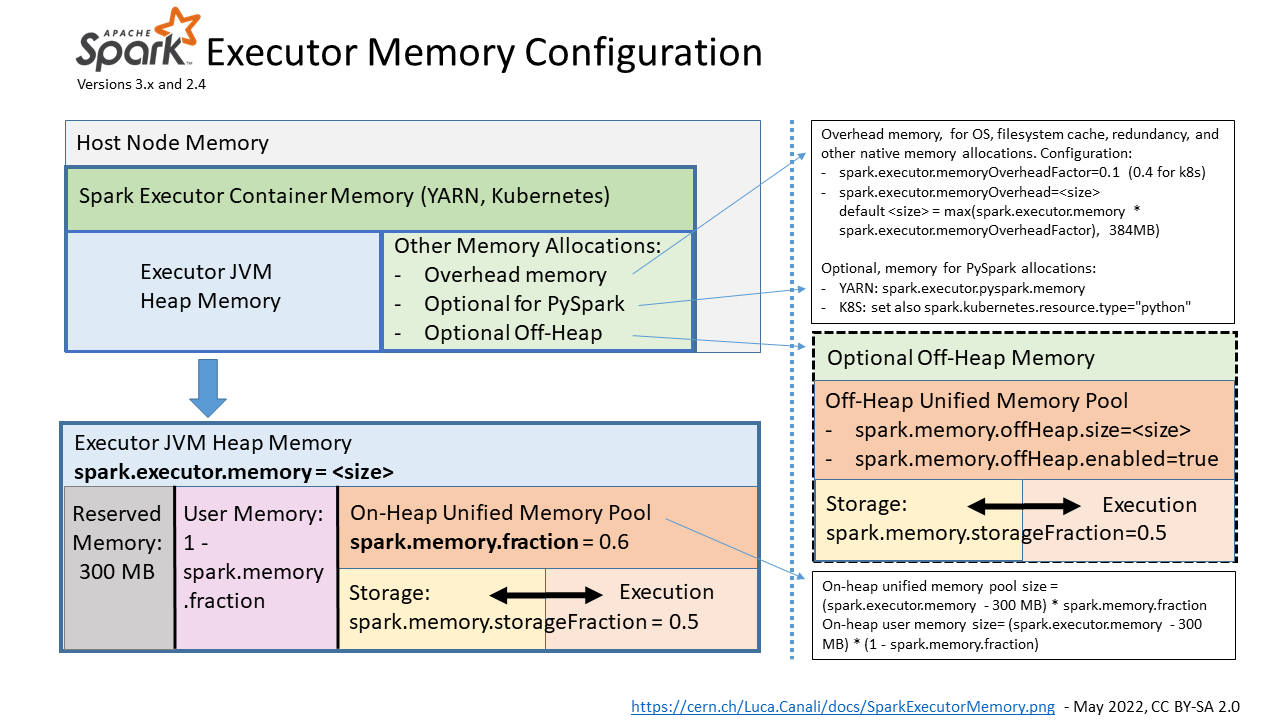
source: https://externaltable.blogspot.com/2020/08/apache-spark-30-memory-monitoring.html
Blocks
Most Spark data including RDDs, broadcasts, stream data, operations (shuffle/joins/sorts/aggregations/etc.), task results, are stored as Blocks and can live on heap, off heap, or on disk. Blocks are managed by each node’s BlockManager class.
JVM Heap
Here is a breakdown of the memory areas on the JVM heap:
| Memory Area | Use case | Size |
|---|---|---|
| Execution | Used for shuffles, joins, sorts, and aggregations. Evicted after each operation. Metrics found Execution tab of SparkUI. Causes OOM if full | spark.executor.memory * spark.memory.fraction * (1 - spark.memory.storageFraction) |
| Storage | Used for cached partitions, broadcasts. Used in MEMORY_AND_DISK storage mode. Not used in DISK_ONLY mode. Spills to disk if full | spark.executor.memory * spark.memory.fraction * spark.memory.storageFraction |
| User | Used by user defined data structure. Spark will not account on whether this memory boundary is respected. Causes OOM if full | spark.executor.memory * (1 - spark.memory.fraction) |
| Reserved | Reserved for Spark system | RESERVED_SYSTEM_MEMORY_BYTES |
JVM Heap OOM
When OOMs occur in the JVM heap, they will be logged to the executor logs. Here are some common OOMs and how to mitigate them:
java.lang.OutOfMemoryError: Java heap space
- If the OOM is gradual, you can monitor it in the Execution tab of SparkUI
- You can enable a heap dump by
-XX:+HeapDumpOnOutOfMemoryError -XX:HeapDumpPath=/tmp/[path]to thespark.executor.extraJavaOptionsflag - You can diagnose a heap dump using profilers such as JProfiler, VisualVM, Eclipse MAT and look causes of large heap space usage
java.lang.OutOfMemoryError: unable to create new native thread
- This is due to excessive thread allocation
- To verify, you can:
- Get the executor process id:
ps aux | grep "executor-id" - Check the thread count:
ps -p $EXECUTOR_ID -lfT | wc -l
- Get the executor process id:
- You can use Spark UI or jstack to create a thread dump to check the cause
- If the threads are managed by a thread pool, you may need to use a thread allocation profiler to capture thread allocation event
java.lang.OutOfMemoryError: GC overhead limit exceeded
- This is due to the garbage collector not being able to catch up with the object creation
- A heap dump can help diagnose large heap space usage
- You can try using G1GC with
-XX:+UseG1GCand tune GC - It is possible that this is caused by excessive parallelism, you can:
- Reduce concurrency, controlled by
spark.executor.cores - Increase partition size, controlled by
spark.shuffle.partitions
- Reduce concurrency, controlled by
- Tune data serialization
Off Heap
Here is a breakdown of the memory areas off heap:
| Memory Area | Use case | Size |
|---|---|---|
| Overhead | Used for OS filesystem cache, native workloads. Causes OOM if full | spark.executor.memoryOverhead |
| OffHeap | Used for off-heap workloads not managed by JVM GC | spark.executor.offHeap.size |
Off-heap errors are harder to diagnose, some common symptoms are:
- JVM resident set size increases beyond Spark heap size (found in Spark UI) and reaches
spark.executor.memoryOverhead - Nodes fail with
Container killed on request. Exit code is 137 - Host OS (Linux) may purge the process, logs may be found in
/var/log/syslog - To diagnose, you can use a profiler for analyze off-heap memory such as jemalloc